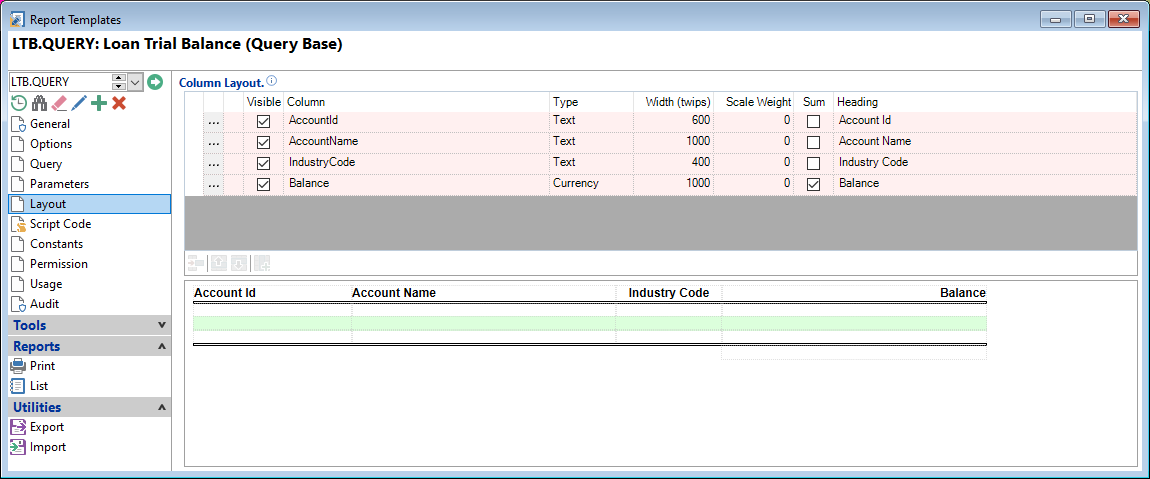
The Layout Page gives you a grid view of the columns that will show in your report and the way they are compiled.
| Column | Description |
|---|
| Drilldown | Clicking the  will open the Report Template Column Properties wizard. will open the Report Template Column Properties wizard. |
| Visible | Tick to make this column show in the report |
| Column | The database field the column is referencing |
| Type | The Type of data this column displays. Can be Boolean(True/False), Code(finPOWER Connect ObjectId), Currency, Date, DateTime, Number, Text. |
| Width (twips) | The size of the column in twips (In printing terms, there are 567 twips to a centimeter and 1440 to an inch) |
| Scale Weight | Columns are scaled according to their Scale Weight value compared to the total Scale Weight. |
| Sum | Tick if you want this column to show a Sum Total at the bottom. |
| Heading | The actual Heading that will be displayed at the top of each column in the report. |

 will open the Report Template Column Properties wizard.


